Custom scientific software for research groups and engineering teams. We connect computational code, data and visualization in an interface for configuring experiments, running calculations and examining results.
Computation and visualization togetherTechnion research experienceTools for ongoing work↓
Founder experience and projects
Relevant experience
A research tool developed at the Technion
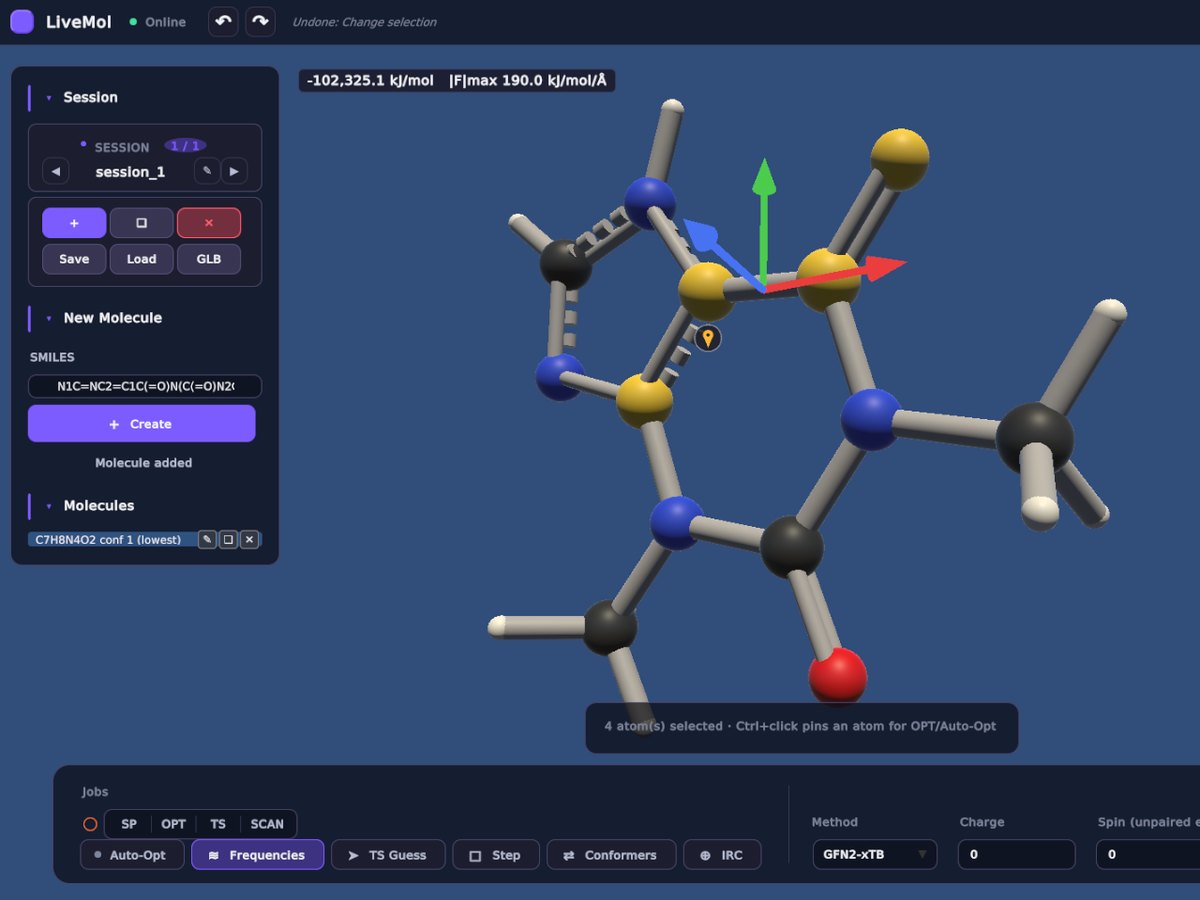
LiveMol combines scientific computation with interactive molecular visualization. It demonstrates connecting computation components to an interface designed for research workflows.
A system connecting calculations with interactive molecular visualization. Researchers move from data to visual structure and explore it within the same workspace.
Planning starts with existing code and data, the research protocol and results to examine. We also define model limitations and validation criteria with the scientific team.
01 / INSIGHT
Scientific visualization
Display structures and results in 3D with selection, comparison and interactive exploration. The presentation follows the data and research question.
02 / EXPERIMENT
Interfaces for running calculations
An interface for setting parameters, executing computational code and displaying output. We assess integration of existing code, including Python, according to dependencies and performance requirements.
03 / VISUALIZATION
Exploration and demonstration tools
Adapt the interface for researchers, partners or teaching. Different work modes can be defined without changing the model's scientific assumptions.
More than a decade of software and real-time 3D development in industry and research.
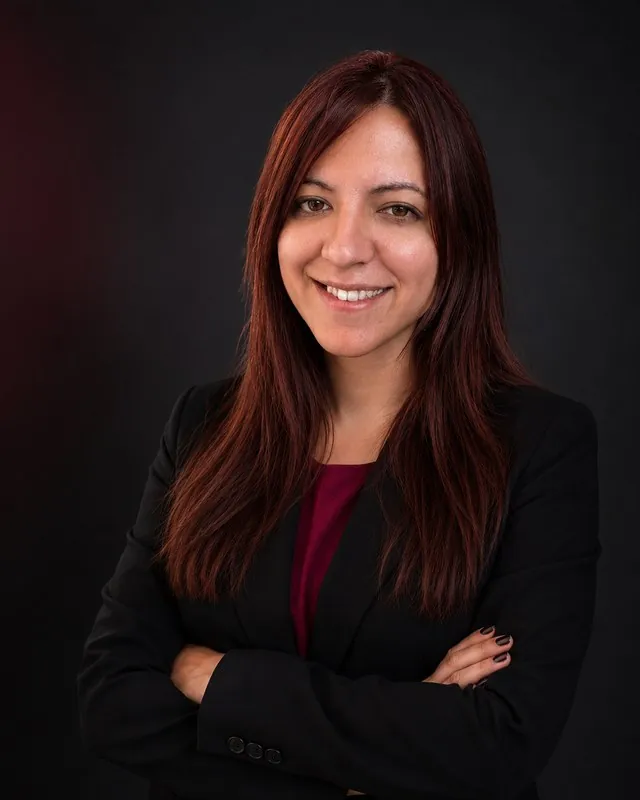
Yulia leads planning, design and development. Specialists join as the project requires, with one clear point of contact for you.
B.Sc Software engineering, TechnionMBA Tel Aviv University
Project stages
How we work
01
Map code and data
Understand the question, data and existing tools.
Deliverable: scientific and technical requirements
02
Test the interface connection
Connect one calculation or dataset to an initial interface.
Deliverable: a proof of concept
03
Develop the workspace
Build computation, visualization and workflow.
Deliverable: a research tool
04
Validate against reference results
Compare reference results and document usage.
Deliverable: handover and agreed validation
Before we start
Frequently asked questions
Can existing research code connect to a new interface?
We assess the language, dependencies, data formats and performance requirements, then define an appropriate connection between computation and interface.
How do you stay faithful to the scientific model?
We agree on reference results, test cases and known limitations with the research team. Computation and visualization are checked against those criteria.
Can the tool also support demonstrations and teaching?
Different exploration and demonstration modes can be planned for the audience and needs. Scope, level of detail and permissions are defined during planning.
What is required from the research team during development?
Code or a model documented as fully as possible, sample data and reference results for comparison. Researchers define the scientific meaning and validate results; development focuses on implementation, interface and connections between components.
The next step
Let's discuss your project
Tell us about the model, data and where existing tools limit your work.